Every developer’s nightmare is that his/her code crashes in production because of the (unexpectedly) high workload. When a new project starts, no one can predict precisely how many people will use it which makes designing the application and the infrastructure quite hard from a performance requirement point of view. Not to mention that there is not always … let me rephrase there is never enough money and time to create THE perfectly scalable and resource efficient software. But this can be a problem during the software’s lifecycle as well, not just in the beginning: as the software evolves we need to be aware of it’s limits. This is where performance testing helps.
Performance testing in general
Performance testing in general is a way to gather information about a system’s behaviour (stability, responsiveness, etc) under a specific workload. Since it is a system level test it provides you information about the application and the infrastructure (network, storage, other system components) as well, which makes the results extremely useful for all parties involved (development, operations, etc).
The most common goals of performance testing:
- verify that the system works correctly (and continues to do so) under a specific workload (load/soak testing)
- determine how the system behaves when the workload goes above the expected maximum (stress/spike testing)
- identify an optimal infrastructure by testing the behaviour of the system with different configurations, network components, etc (configuration testing)
When running these kind of tests, it is essential that the test environment is as close to the production one as possible, otherwise correct results cannot be guaranteed. It’s probably also obvious, that the infrastructure which executes the tests, should be as flexible as possible (like in terms of resources), otherwise the limitations (like network speed) might affect the results as well. For example: a developer computer is not really ideal for the role of the test coordinator.
About JMeter
There are quite a few performance testing tools out there, JMeter (made by the Apache Foundation) is one of the most popular ones. It is written in Java (which guarantees the “beauty” of the user interface) and comes with a long list of features. What makes it really powerful is that you can use the GUI to create and test a so called “Test Plan” which then you can run in non-GUI mode saving a lot of resources since the process itself can be very resource intensive. It also supports remote execution which means it can communicate with other instances of the program (running on other machines) and run the test plan on them. Last, but not least: it is able to save the results in a report file which then can be visualized in GUI mode again.
Compared to paid hosted services (like Loader.io), JMeter is cost effective and has most of their features (if not more) which makes it a real alternative.
Note: Covering every feature of JMeter in this post is impossible. Fortunately it has quite a good documentation with getting started guide, detailed reference and best practices.
Prerequisites
To achieve the best results we are going to run JMeter on VMs (DigitalOcean droplets for now, so first you need to register to DigitalOcean and buy at least $5 credits). Note the plural form: we are going to run it on multiple droplets using the remote execution feature.
In JMeter terminology the two parties involved in remote execution are called Master and Slave.
The Master is in charge of controlling the test and the slaves. It can be run on a local machine as well (even in GUI mode), but as I already mentioned it is considered to be a good practice to run the everything on servers in non-GUI mode.
The Slave does the actual work: accepts commands from the Master and runs the test. Since it is responsible for generating the load, you need to give it enough resources.
So go ahead and create some droplet. For simplicity I suggest you using the following specs for both Master and Slaves: Ubuntu 14.04 2GB RAM in whichever region you want (you can follow the above link to get the desired configuration). The guide assumes that you either write down the root password or set up an SSH Key.
You will also need to install JMeter on your computer in order to create test plans.
Adjust the following configurations to personalize the instructions bellow.
Setting up slaves
Let’s start with setting up the slaves, installing Java and JMeter:
$ ssh root@SLAVE
$ apt-get update -qq
$ apt-get install -y -qq openjdk-7-jre-headless
$ cd /tmp
$ wget https://www.apache.org/dist/jmeter/binaries/apache-jmeter-3.1.tgz
$ wget https://www.apache.org/dist/jmeter/binaries/apache-jmeter-3.1.tgz.md5
$ md5sum -c apache-jmeter-3.1.tgz.md5
$ mkdir -p /opt/jmeter
$ tar -xf apache-jmeter-3.1.tgz -C /opt/jmeter --strip-components=1
$ rm -rf apache-jmeter-3.1.tgz*
When that’s ready, configure JMeter to run in server mode and listen for instructions on it’s public IP:
$ wget https://gist.githubusercontent.com/kamermans/2830209/raw/9ecee450adce01ef1767d04ec97d0d79235c0d03/jmeter-server.sh
$ mv jmeter-server.sh /etc/init.d/jmeter
$ sed -i -e 's/JMETER_IP=.*/JMETER_IP=SLAVE/g' /etc/init.d/jmeter
$ chmod +x /etc/init.d/jmeter
$ /etc/init.d/jmeter start
That’s it, your slave is ready. Repeat this step to setup more slaves.
Setting up the master
Setting up the master is even easier. You should also start with installing Java and JMeter:
$ ssh root@MASTER
$ apt-get update -qq
$ apt-get install -y -qq openjdk-7-jre-headless
$ cd /tmp
$ wget https://www.apache.org/dist/jmeter/binaries/apache-jmeter-3.1.tgz
$ wget https://www.apache.org/dist/jmeter/binaries/apache-jmeter-3.1.tgz.md5
$ md5sum -c apache-jmeter-3.1.tgz.md5
$ mkdir -p /opt/jmeter
$ tar -xf apache-jmeter-3.1.tgz -C /opt/jmeter --strip-components=1
$ rm -rf apache-jmeter-3.1.tgz*
Next you have to remove a hosts file entry, otherwise the slaves will try to connect back to 127.0.1.1 which is obviously wrong:
$ sed -i -e '/127.0.1.1.*/d' /etc/hosts(You have to do this because the master tries to determine it’s public IP by resolving the hostname which is automatically configured in the hosts file to point to the IP address above.)
As a last (optional) step you can configure the slaves as a comma separated list in JMeter’s configuration:
$ sed -i -e 's/remote_hosts=.*/remote_hosts=SLAVE/g' /opt/jmeter/bin/jmeter.propertiesYou can pass the list of IP addresses to the master during the test execution as well.
Creating a test plan
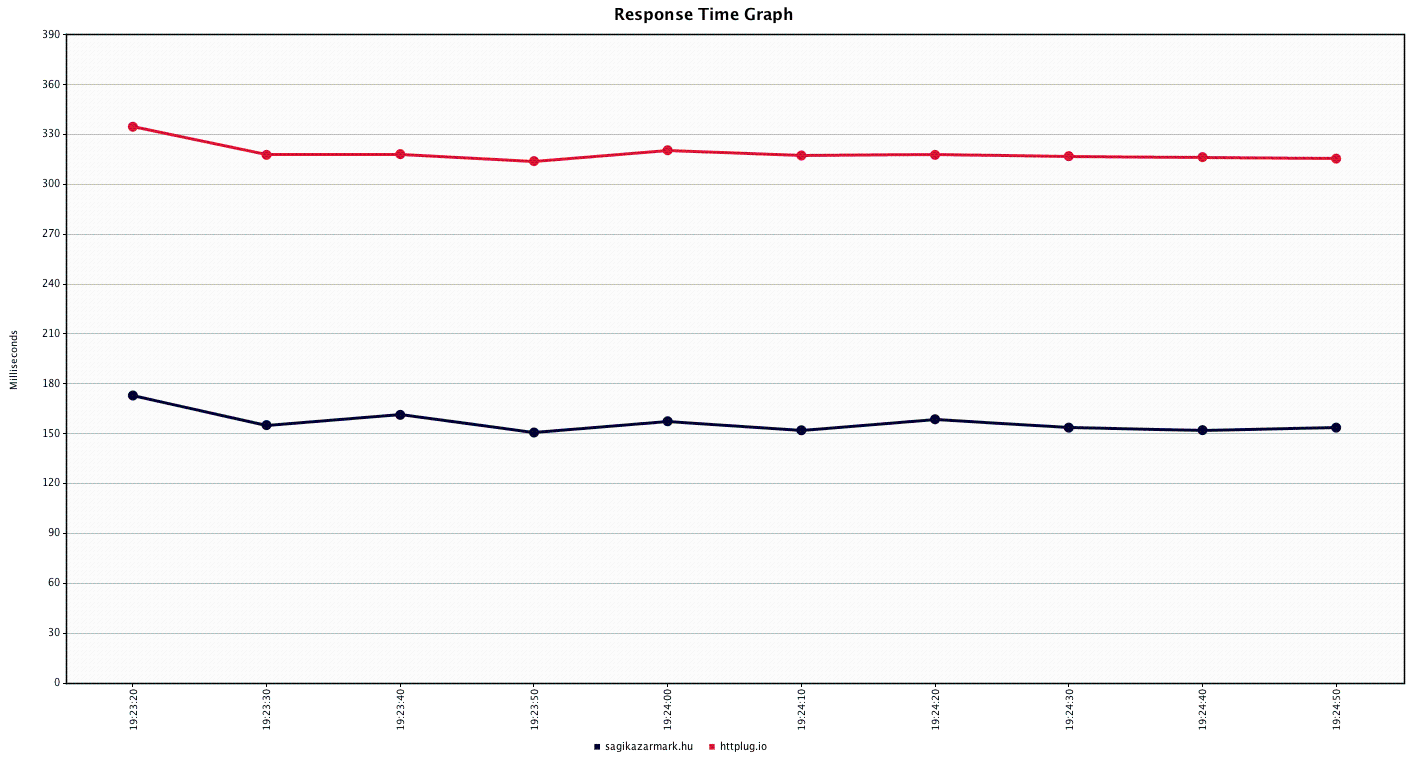
In JMeter’s terminology the test plan contains all the necessary details to execute the tests. The easiest way to create a test plan is using the GUI. So let’s create a simple test plan which compares the response times of this website with another that I’ve created (http://httplug.io).
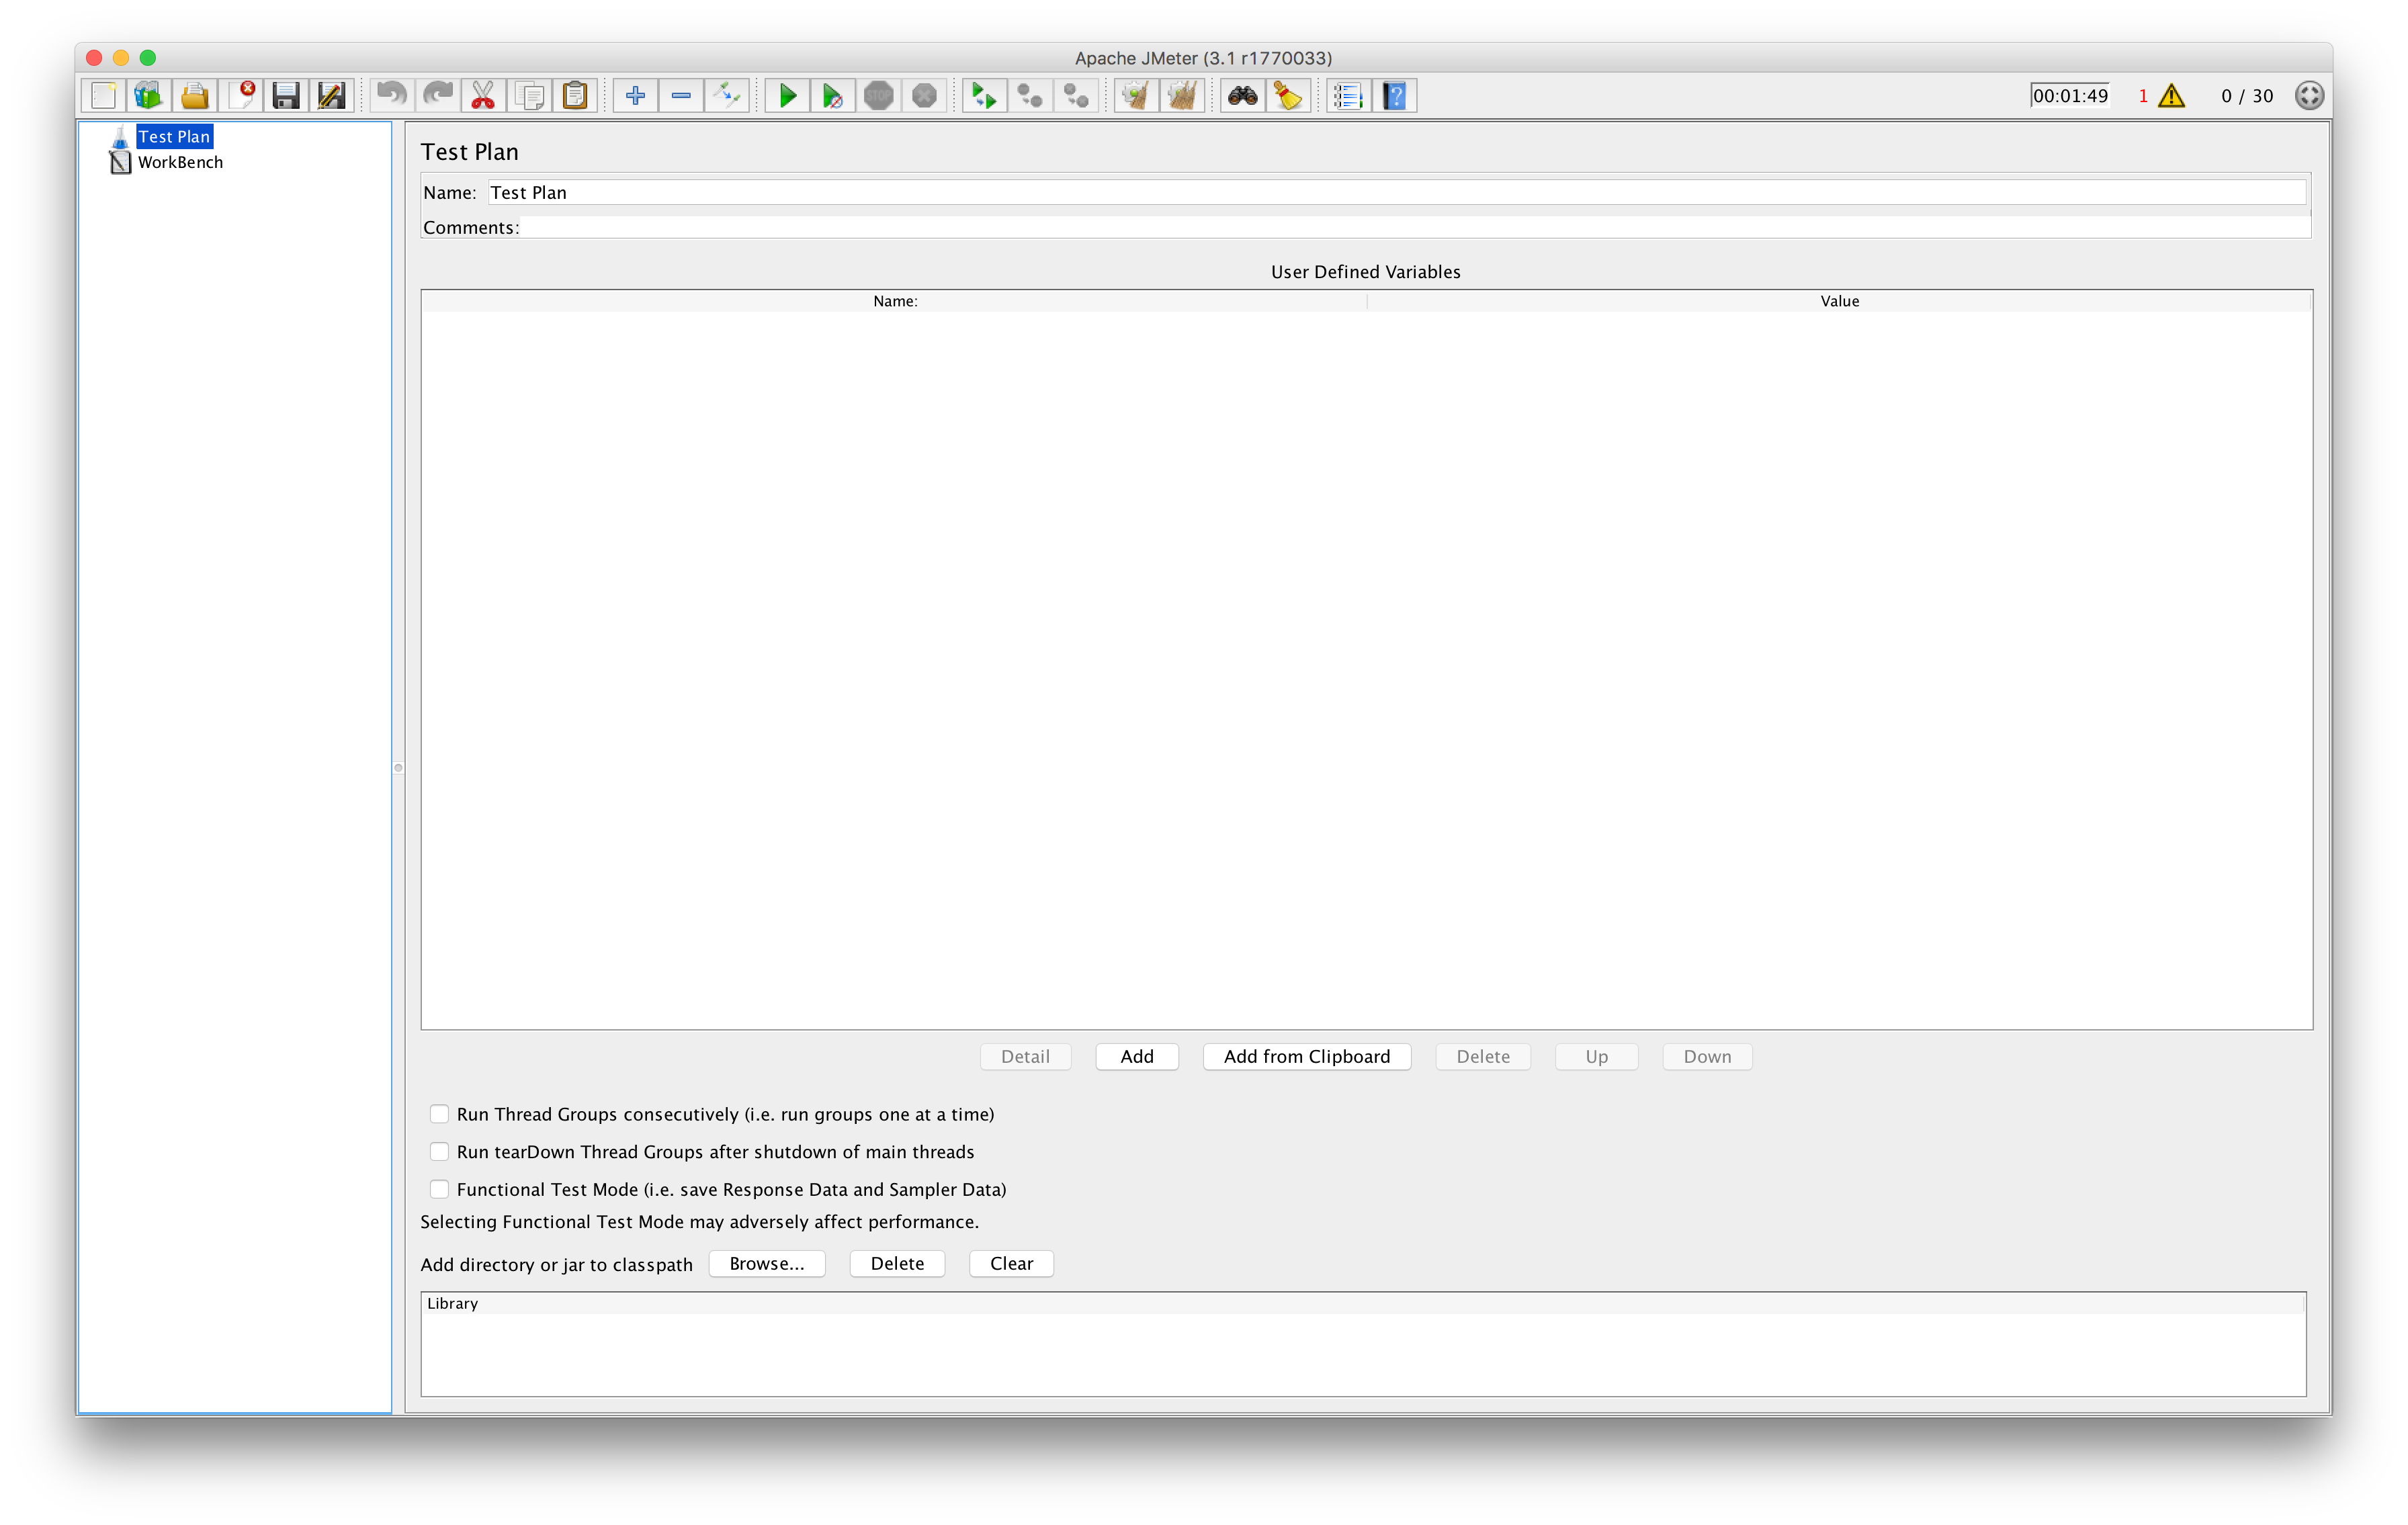
When you open the application you should see an empty element on the left side called “Test Plan”:
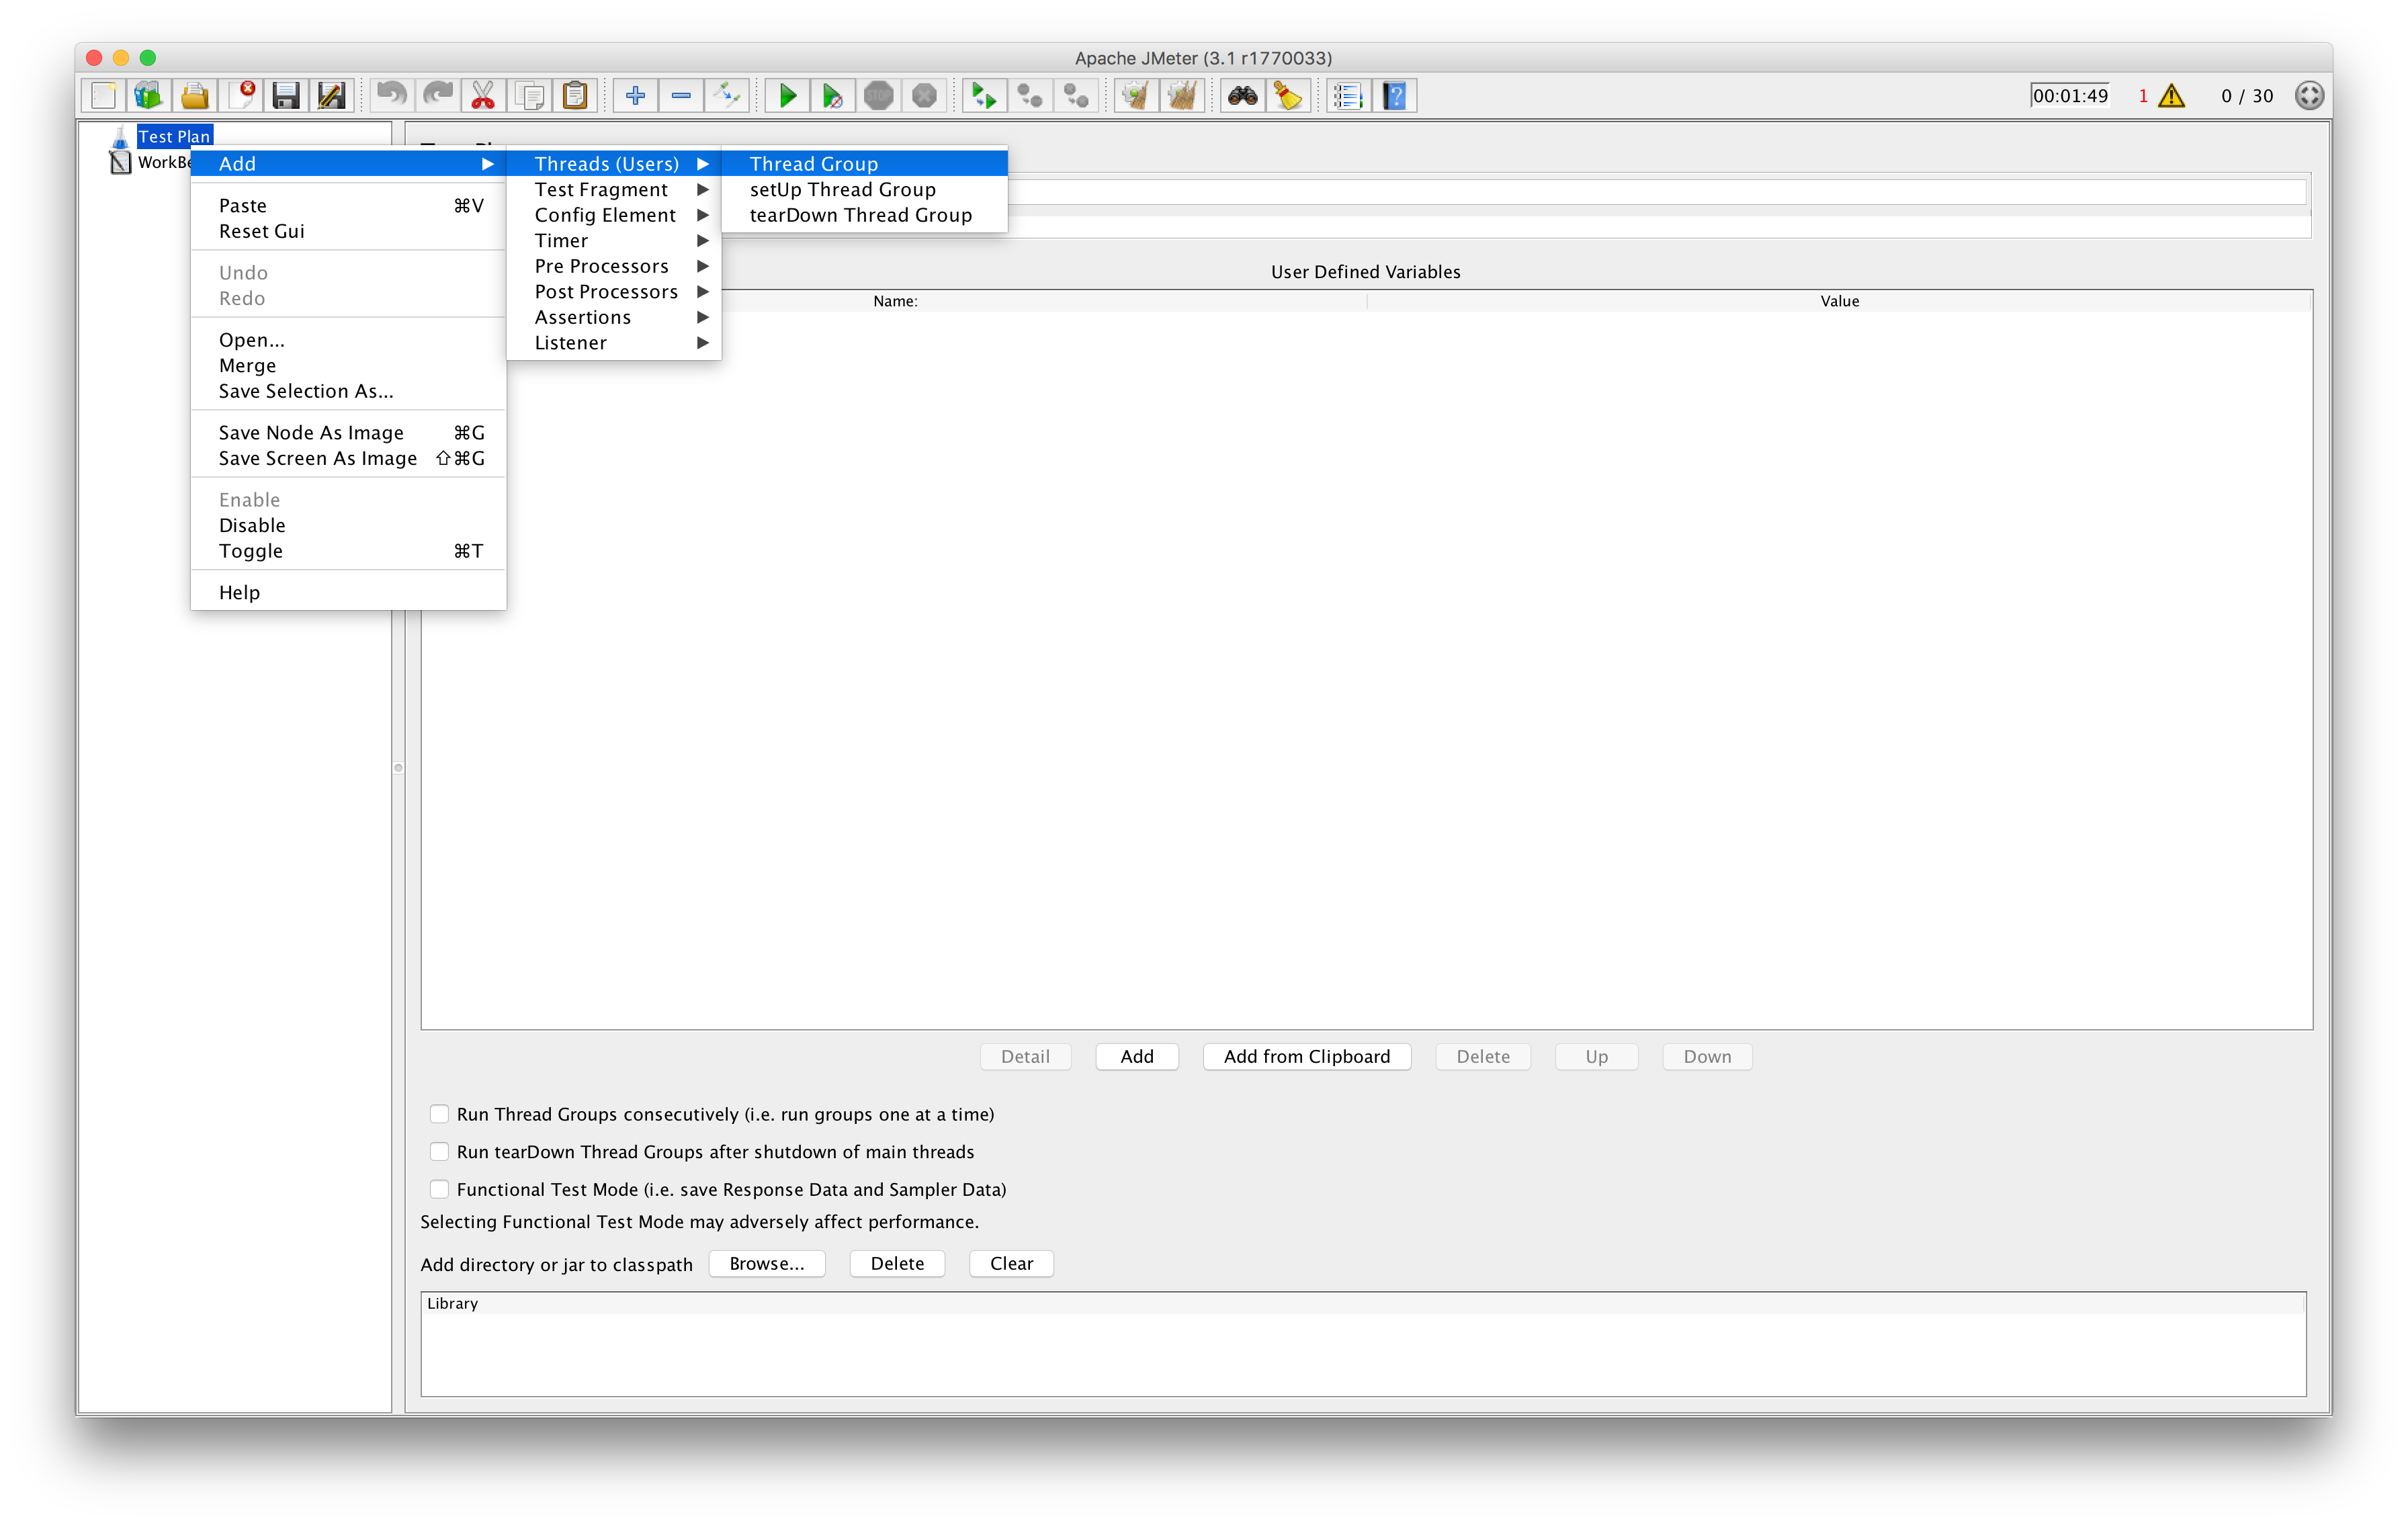
The first thing that you need to create is a Thread Group:
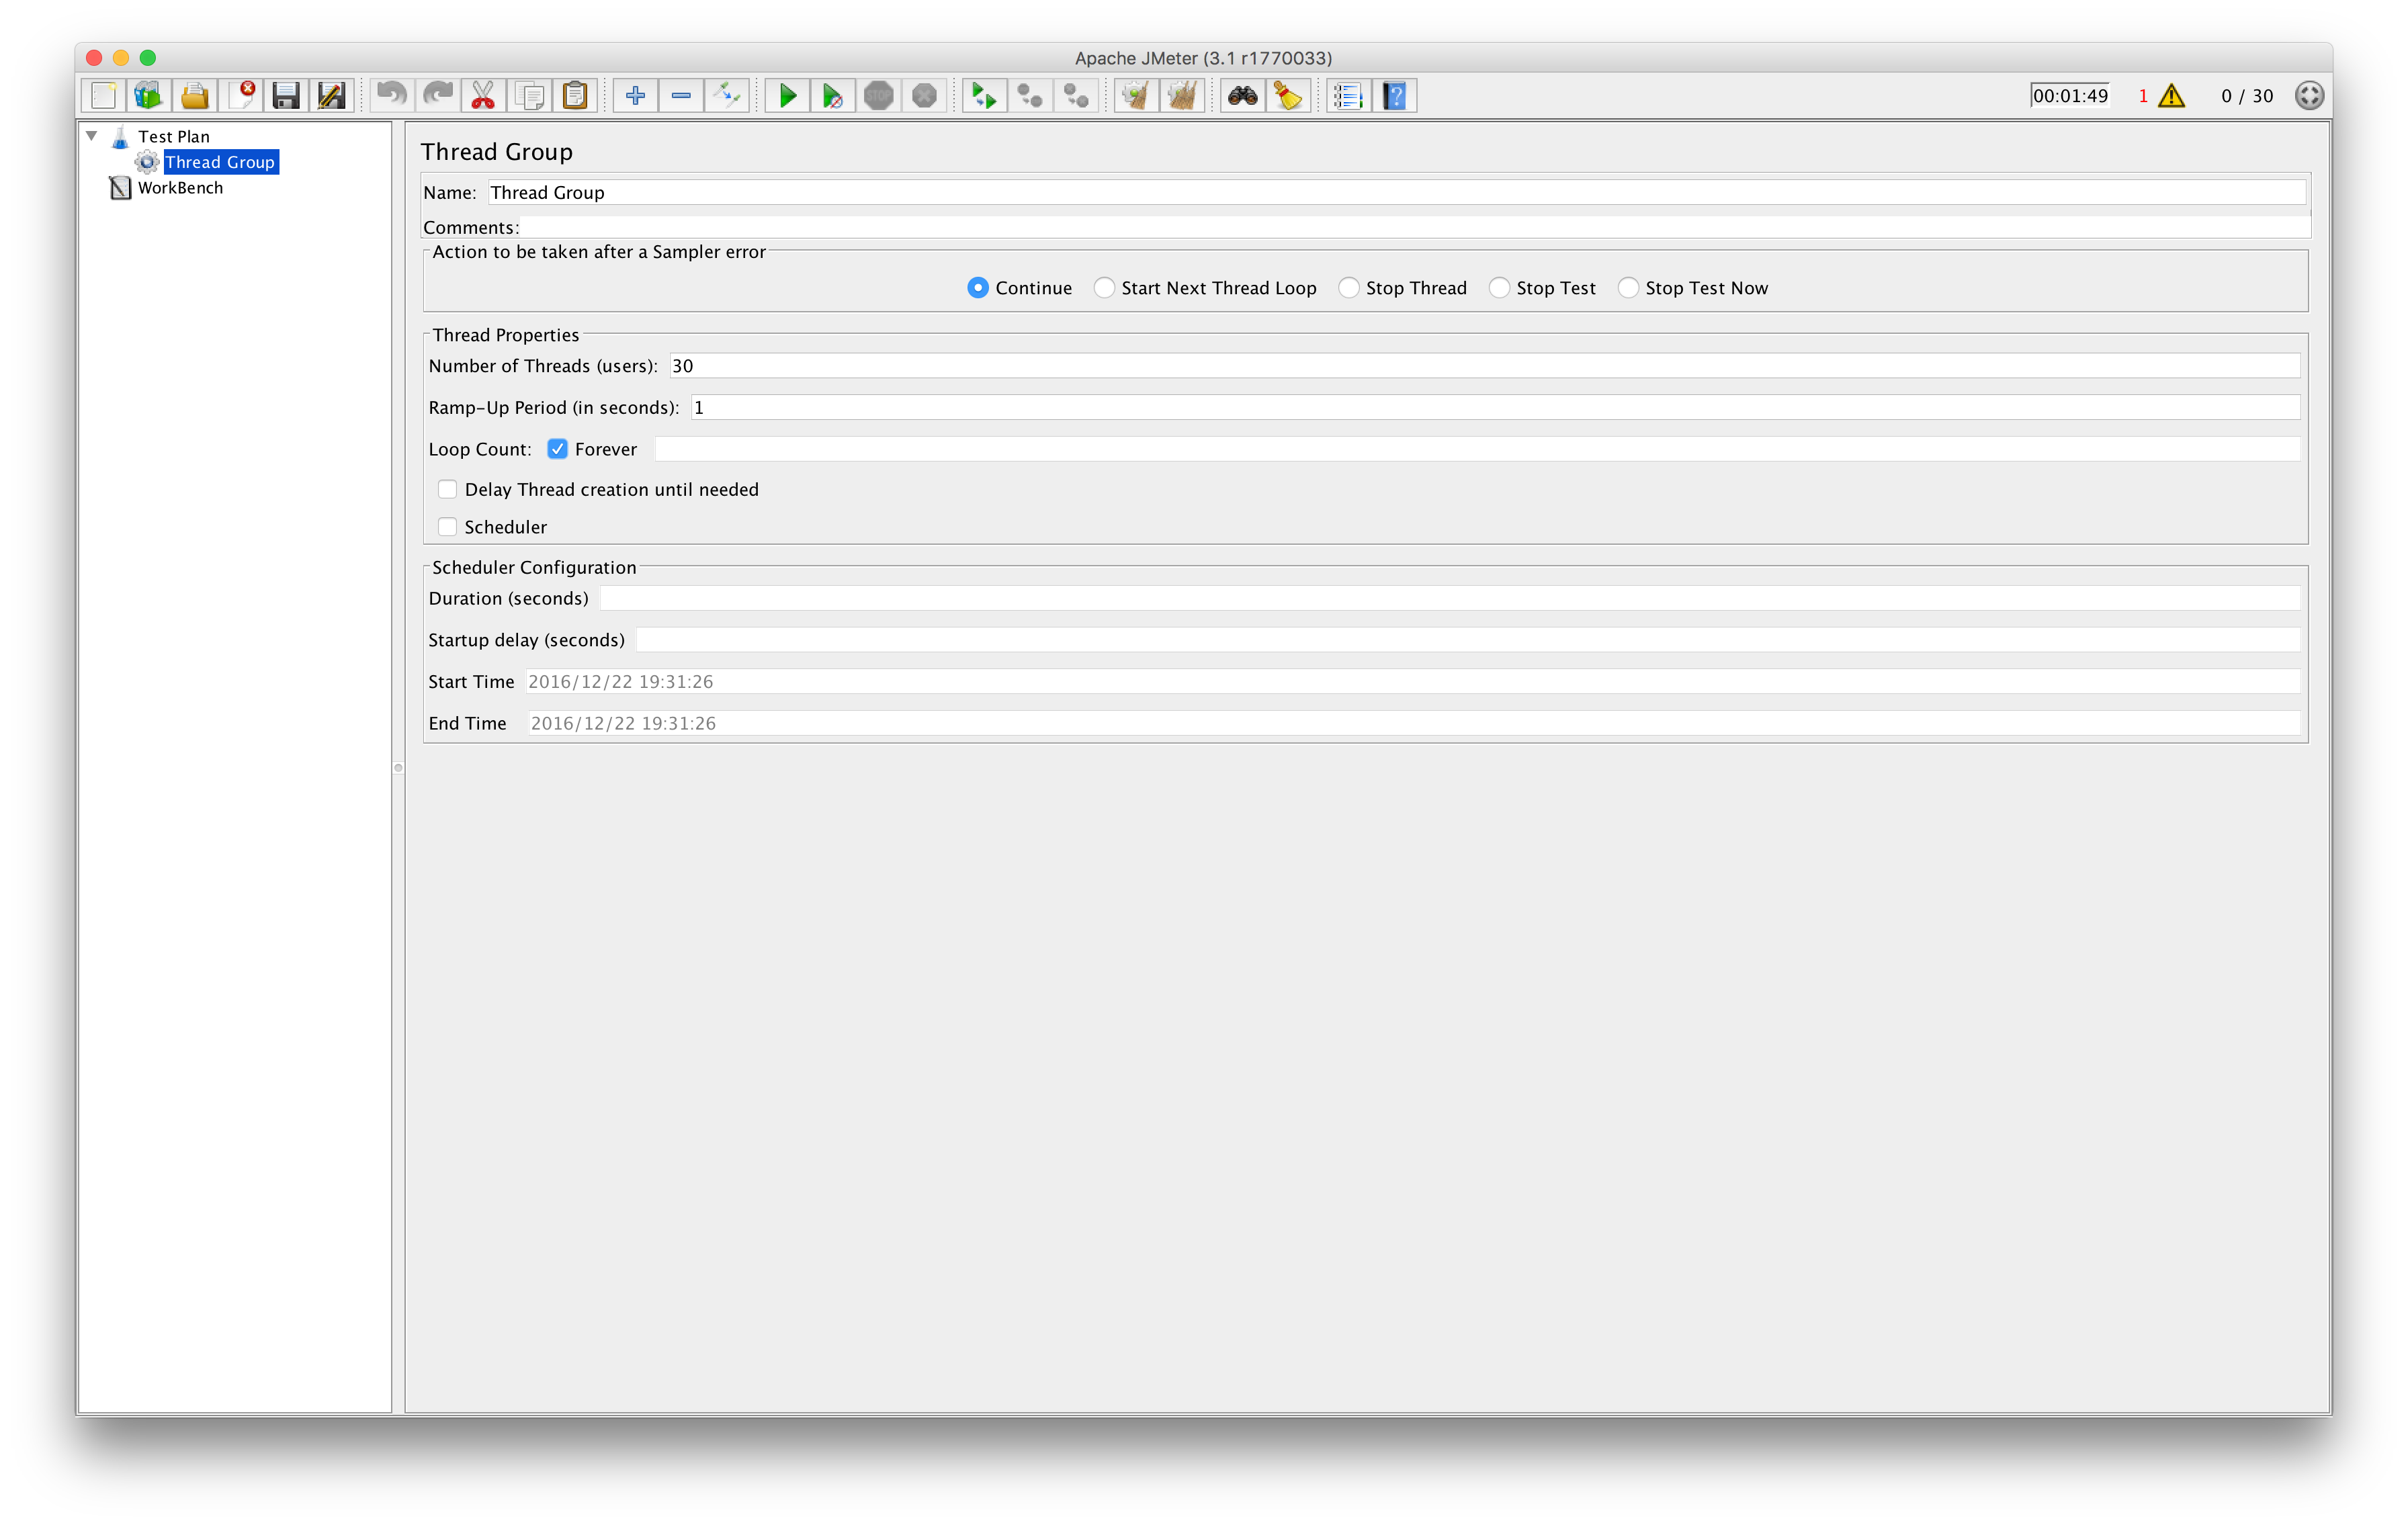
The Thread Group let’s you configure some details about the workload: concurrent number of users and how long/how many times the tests should run (setting this values to 30 and 100 should be fine for now):
Then we can add an actual test (called a Sampler in JMeter terminology) which is an HTTP Request in our case:
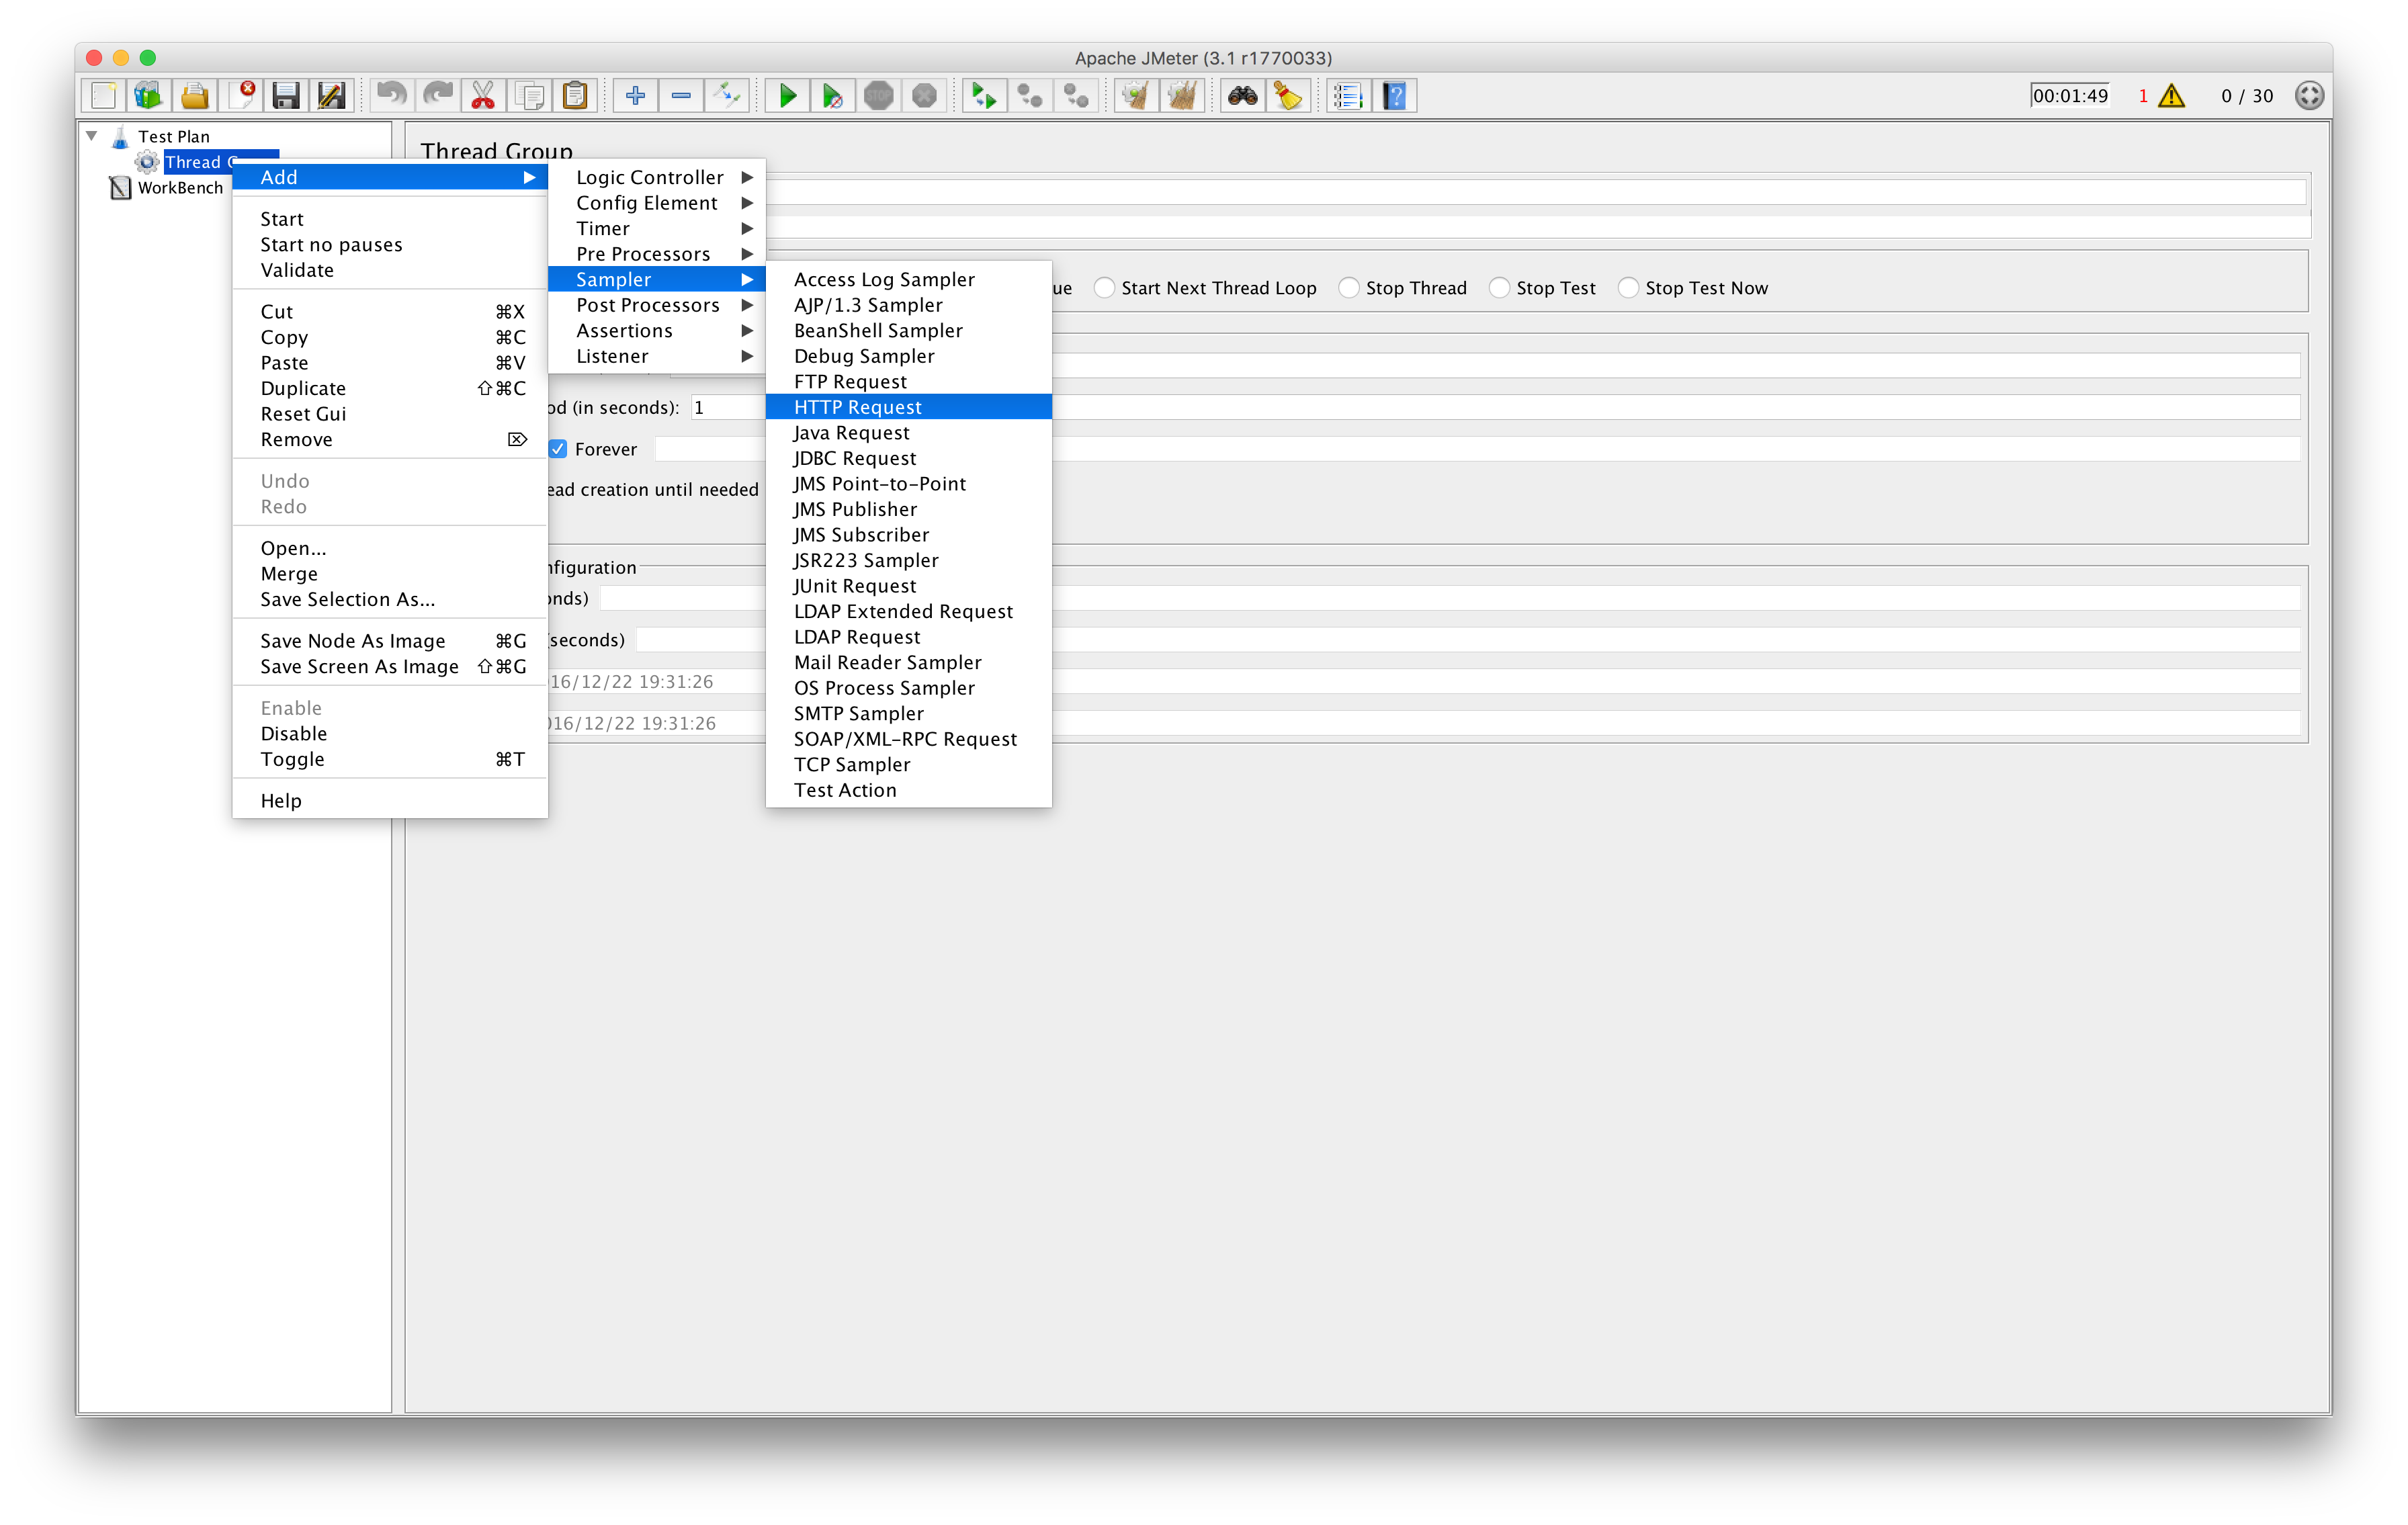
Make sure to repeat this step and add the values sagikazarmark.hu and httplug.io:
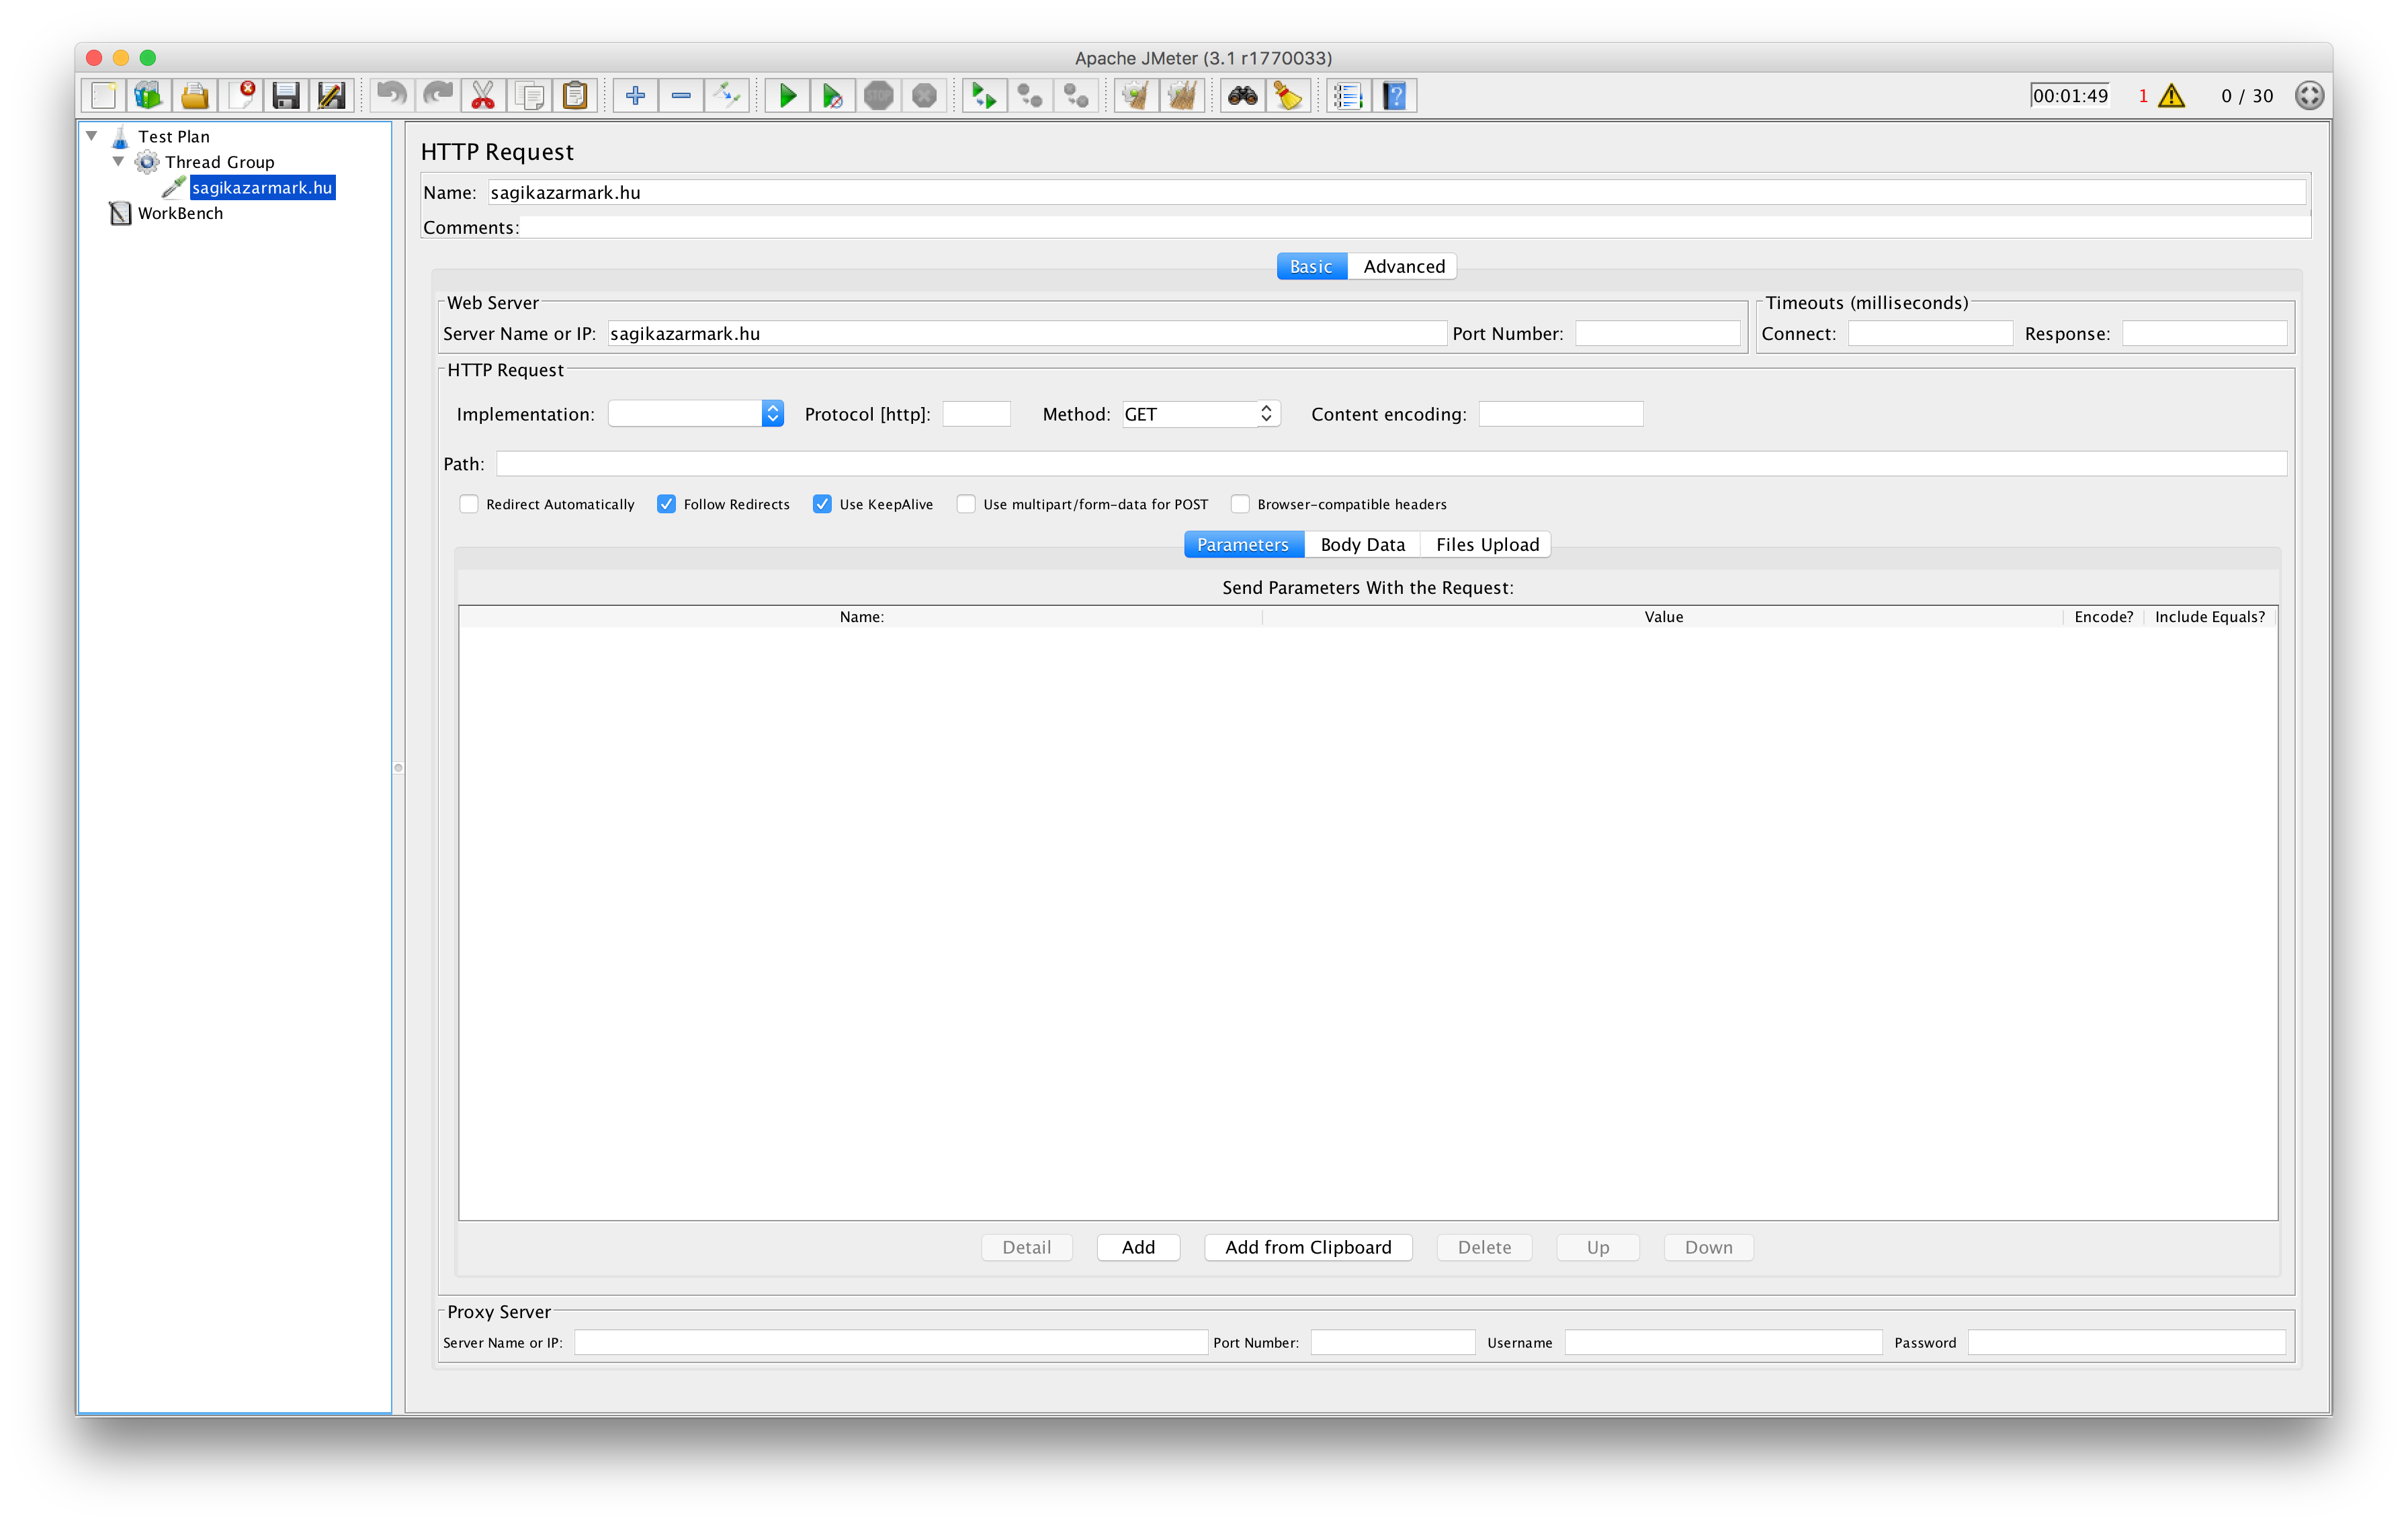
Congratulations! Your first test plan is ready. Save it in a file and advance to the next step.
If you don’t want to spend time with creating a test plan you can download the one I used from here.
Executing tests
When you are ready with your test plan, you can upload it to the master server, execute it and then download the results:
$ scp path/to/test.jmx root@MASTER:
$ ssh root@MASTER /opt/jmeter/bin/jmeter -n -r -t test.jmx -l results.jtl
$ scp root@MASTER:results.jtl path/to/results.jtl
(based on the test plan this could take hours, so suggest you running these commands step by step)
If you haven’t configured the list of slaves in the master’s configuration then you have to pass the list of IP addresses to the command
(instead of the -r switch you have to use -R SLAVE[,SLAVE2]):
$ ssh root@MASTER /opt/jmeter/bin/jmeter -n -R SLAVE -t test.jmx -l results.jtlThe result file then can be opened by JMeter to analyze and visualize data. For example to see the response times in a graph open the GUI again and add a Response Time Graph listener to your test plan:
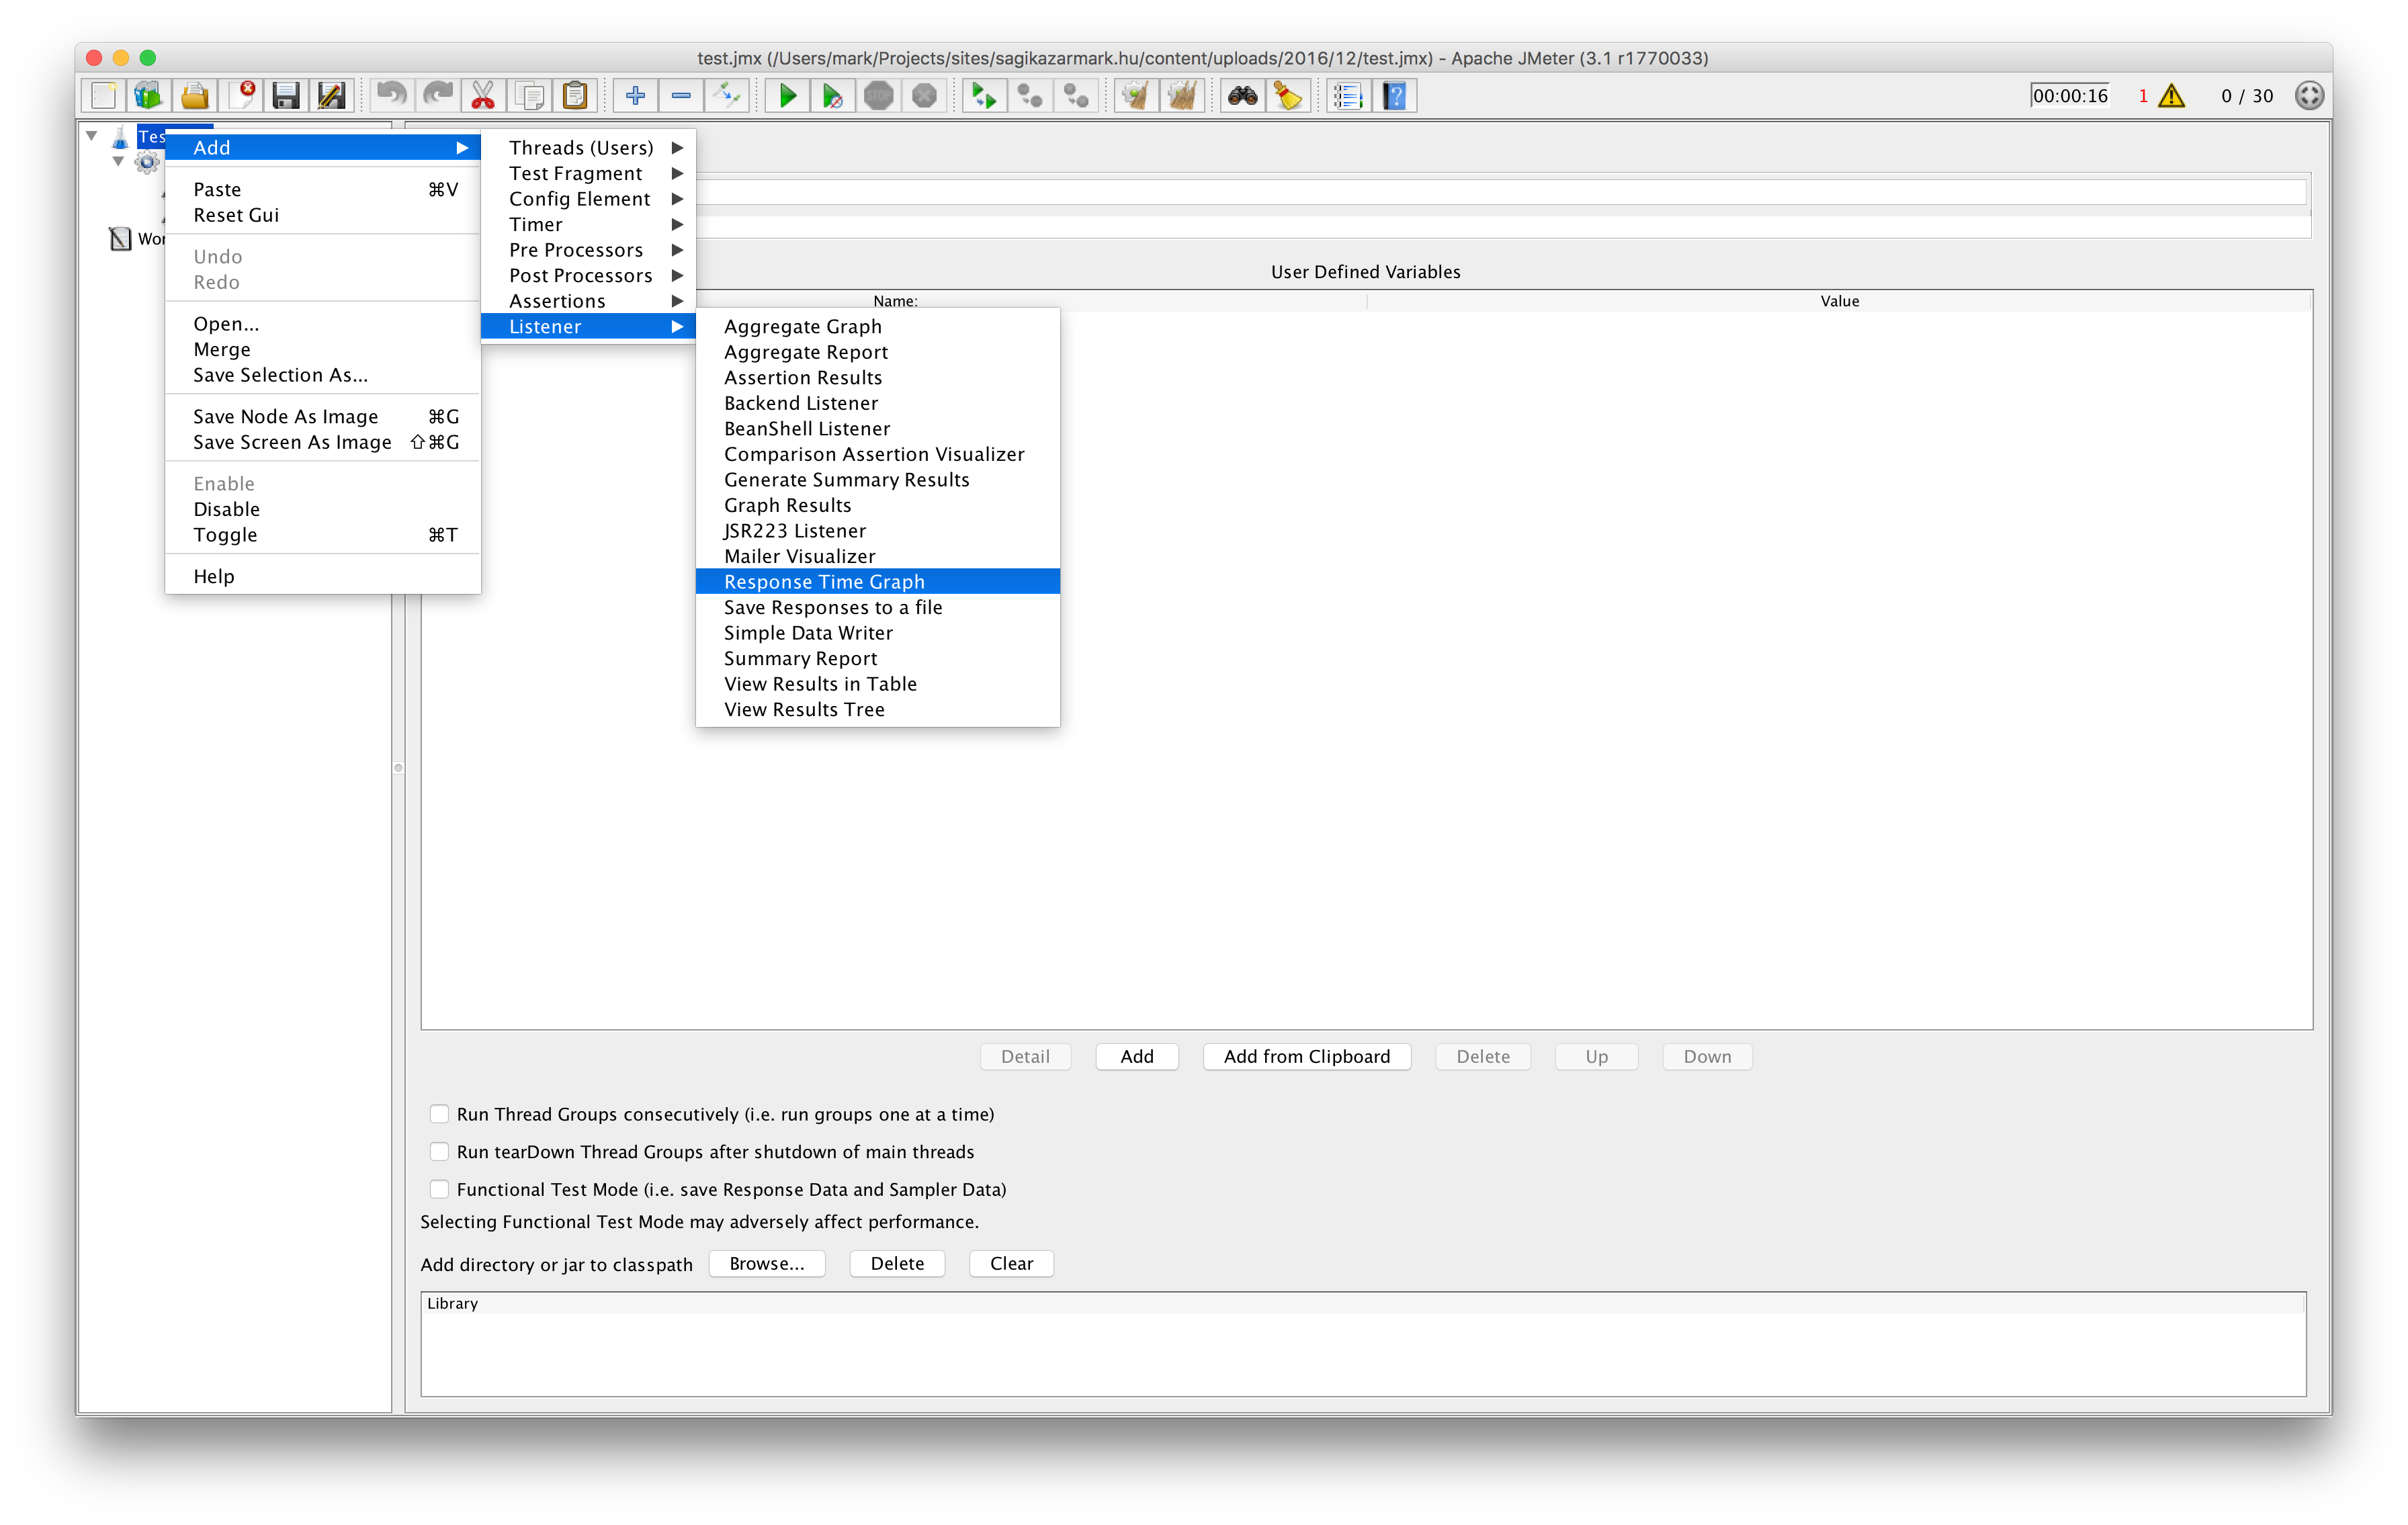
Then you should see a similar graph to this:
Let’s automate
This testing infrastructure gives you almost all (if not more) features that the hosted services, but it is not really perfect in it’s current form.
First of all it’s not free since you have to pay for the droplets you use, but fortunately DigitalOcean’s price model allows hourly pricing, so you can simply destroy the created droplets if you don’t need them anymore.
But this gets us to the second problem which is the overhead of creating the testing infrastructure over and over again. Everyone hates repeated tasks, so we always try to find a way to automate them. In our case Terraform is going to be our tool for that. Terraform allows you not just to provision, but to create (and destroy) the infrastructure as well by supporting a set of providers (including DigitalOcean).
Unfortunately creating the Terraform configuration itself is out of scope for this post, but you can find it with the detailed usage instructions here. By using the quick start guide four simple commands are enough to create, use and destroy the testing infrastructure.
